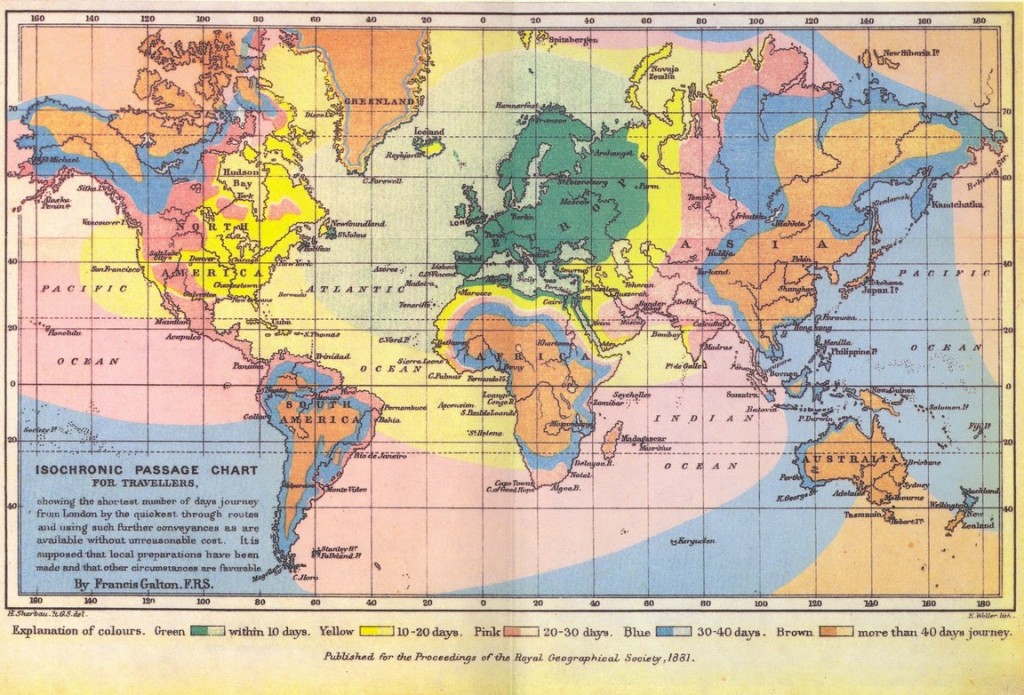
Francis Galton’s Isochronic Passage Chart of 1881, one of the first isochronic maps, indicates the time necessary to travel from London to anywhere else in the world.
Watch enough Star Trek and you will soon overload on the notion of a space-time continuum. Without revisiting Stephen Hawking, let’s agree that there is an intuitive link between these two experiences (space and time) but that we typically conceptualize and visualize each one distinct from the other. In the world of representation there are a number of examples where this rift has been stitched back together. Cartographies of Time by David Rosenberg and Anthony Grafton presents a study of the methods of representing time as they change throughout history, and if we want to understand the experience of space (or data) through map-based representation, there are a number of cartographic techniques that have been developed over the years (Edward Tufte”s books are always a good place to hunt for innovative maps and graphs). But one simple technique that nicely melds space and time is the isochronic map.
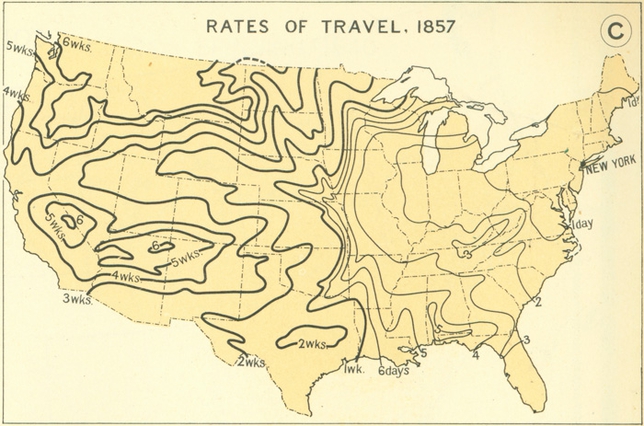
Isochronic map created in the 1930’s showing rail travel times from NYC to other parts of the US, [Image Credit: the 1932 Atlas of the Historical Geography of the US, via Michael Graham Richard]
TIMEMAPS from graphsic on Vimeo.
While these maps are often used to assist commuters in making more informed transit decisions, there is another powerful feature of isochronic maps; historical comparison. Radical Craft’s Isochronic Mountains are intentional misreadings of isochronic lines as topographic lines, materializing the time spent in commute into a mountain of waiting. When placed side by side with the isochronic mountains of other cities, or other moments in time, we can gauge how well any city’s transit infrastructure stacks up. As we compare one urban area to another, the higher the mountain, the more deficient the transit infrastructure: large sprawling cities with transit that has kept pace with development would create plateaus instead of mountains. São Paulo’s weak transit coupled with is mega-sprawl produces an extreme example:
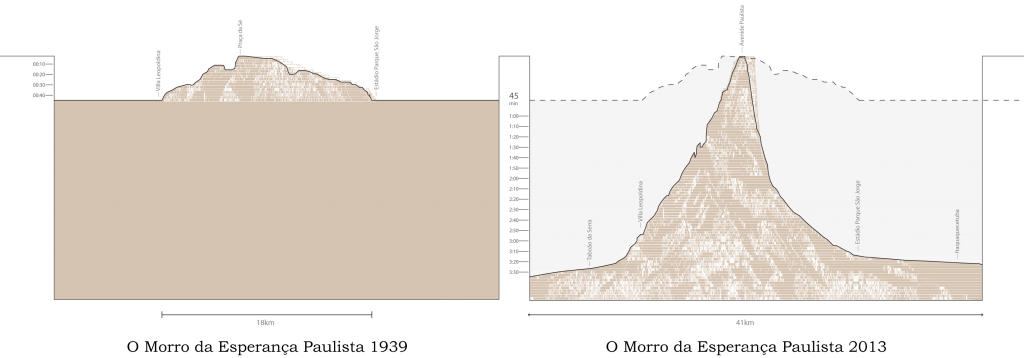
O Morro da Esperança Paulista by Radical Craft. This comparative graph depicts the increase in travel times to and from São Paulo’s city center over the last 75 years. The erosion of public infrastructure becomes evident, due in part to the expansion of the city, but also to the dismantling of the extensive street car (bonde) lines which still existed in 1939.
This new mountain (with the z-axis as time), creates a dynamic topography of the trajectories of travel. Rivers, railways, bridges, and other geographic features, both man-made and natural, impact the accessibility of the various neighborhoods of the city, all registering as geological features – cliff faces and fissures – that channel the lava flows of time. Valleys and the surrounding flatlands represent areas underserved by transit (how many of the region’s favela’s would be condemned to the shadow of access represented by these valleys?).
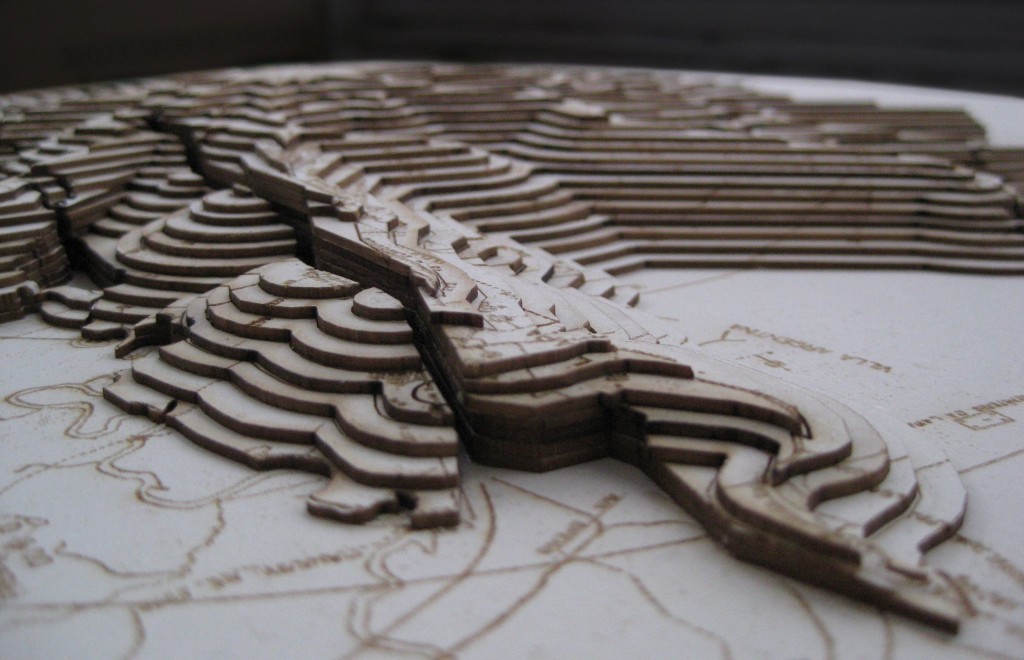
Radical Craft’s Isochronic Mountain of São Paulo’s transit in 1939. As the historic tram lines ply their way into the suburbs, they extend the topography of access emanating from he city center. A chasm appears where access is blocked – here heavy rail lines are crossed only intermittently by bridges which create cascading mounds of connectivity on the other side of the tracks.
While the beautiful precision of the 1833 map below implies an interest in helping urbanized areas avoid being buried by future lava flows, the man-made isochronic mountains of today’s cities offer the possibility of reshaping the terrain of access to the city.
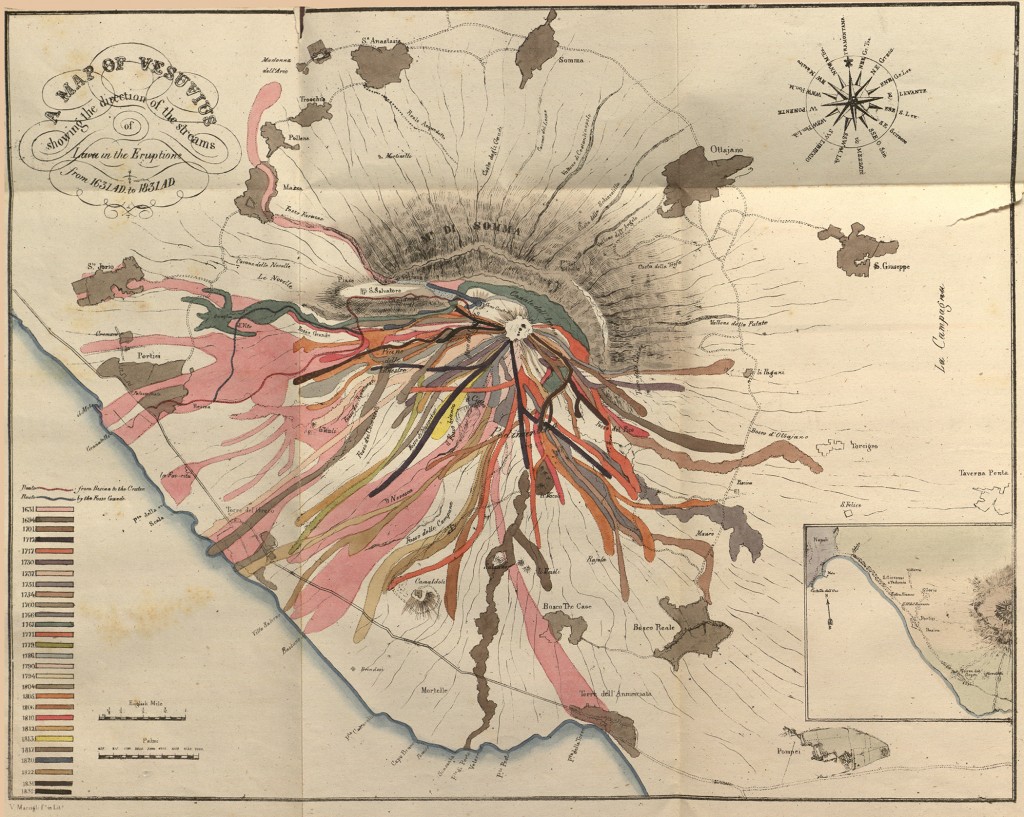
John Richardson Auldjo’s 1833 etching “Map of Vesuvius: showing the direction of the streams of lava in the eruptions from 1631 AD to 1831 AD.” More info at UMD’s Romantic Circles.
